Difference between revisions of "CoE Cluster April 2012"
m (→Results) |
m |
||
| Line 22: | Line 22: | ||
[[File:cuda_mandelbrot.png]] | [[File:cuda_mandelbrot.png]] | ||
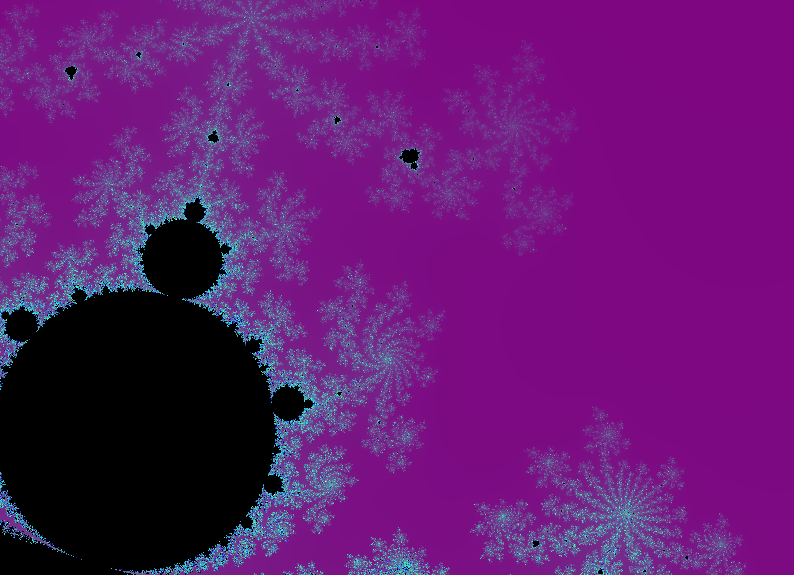
| − | Above: Mandelbrot Set drawn in 0,12 seconds, using a single NVidia CUDA capable graphics card (GeForce GTX 460) running 32 blocks and 128 threads in each block. Total image dimension 512 x 512 pixels. | + | ''Above: Mandelbrot Set drawn in 0,12 seconds, using a single NVidia CUDA capable graphics card (GeForce GTX 460) running 32 blocks and 128 threads in each block. Total image dimension 512 x 512 pixels.'' |
[[File:mpi_mandelbrot.png]] | [[File:mpi_mandelbrot.png]] | ||
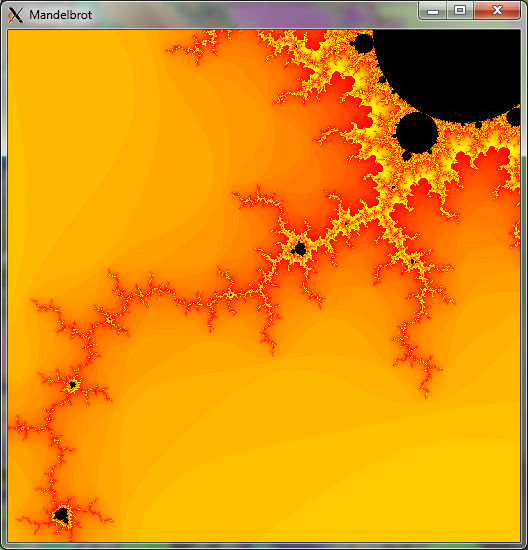
| − | Above: Mandelbrot Set drawn in 1,2 seconds, using a Master-Worker MPI pattern with 16 worker nodes and 1 master node (which collected calculated results from different parts of the image and output them to an X Window). Total image dimension 800 x 800 pixels. | + | ''Above: Mandelbrot Set drawn in 1,2 seconds, using a Master-Worker MPI pattern with 16 worker nodes and 1 master node (which collected calculated results from different parts of the image and output them to an X Window). Total image dimension 800 x 800 pixels.'' |
=Slides= | =Slides= | ||
Revision as of 08:19, 1 May 2012
{{#img: image=Super-computer-artw.jpg | page=Linux Cluster til Center of Excelence/Beskrivelse til CoE West | width=200px | title=Linux Supercomputer projekt }}
Assignments
Results
Having investigated CUDA C programming for Nvidia graphics cards and the CUDA architecture, we made some performance measurements using a range of numbers of blocks and threads, executing in parallel. The test program calculated values of the Mandelbrot Set on a pixel-by-pixel basis. The Mandelbrot Set was a good choice for this test beacuse:
- It is relatively easy to program
- Every pixel has to calculated individually - there is no correlation between values of neighbouring pixels
- The image can be separated into parts which can be calculated separately and in parallel
- The time taken to calculate a complete image without parallelization is long enough to allow the performance gains from parallelization to be clearly seen
- The resulting images are very pretty (if a little strange)! :-)
The results of the benchmarking are here, as an interactive chart (hover your mouse to find out which values are represented by each line, drag to zoom and hide/reveal curves relating to the number of blocks in the legend beneath):
- CUDA Benchmark (External JavaScript)
Along with the CUDA C programming Guide (see Literature List), the CUDA Occupancy Calculator provides a good basis for understanding and explaining the results seen. In general, it was found that more than 32 blocks and/or 128 threads per block did not provide noticable performance gains, whereas there were significant performance gains for every step increase below these values.
Above: Mandelbrot Set drawn in 0,12 seconds, using a single NVidia CUDA capable graphics card (GeForce GTX 460) running 32 blocks and 128 threads in each block. Total image dimension 512 x 512 pixels.
Above: Mandelbrot Set drawn in 1,2 seconds, using a Master-Worker MPI pattern with 16 worker nodes and 1 master node (which collected calculated results from different parts of the image and output them to an X Window). Total image dimension 800 x 800 pixels.
Slides
Litteratur Liste
- MPI
- Introduction to Parallel Computing
- CUDA Overview from Nvidia
- Nvidia CUDA C Programming Guide
- OpenCV Tutorial
- OpenCV Reference
- Skin Detection algorithms for use in OpenCV/CUDA trials

